
Gold and Silver Performance Over Last Six Months
A Few Words about the Last 6 Months of Gold and Silver Charts…
Gold, as I mentioned last week, remains above its 50-day moving average (MA), and moved decisively above its 200-day MA about the same time the Dow Industrials broke down below its 200-day MA. (The moving average is the average closing price over a given number of days.)
The stock market picture is grim. Both the 200-day and the 50-day moving averages have turned down. In fact, the shorter term 50-day moving average broke below the 200-day shortly before Christmas.
If you understand that the trend is your friend and that these trends reflect some long-term economic realities, comparing price action to these longer-term moving averages demonstrates that the trend is not a just a flash in the pan: It is sustained.
Silver has been above its 50-day MA since the beginning of December. Now, like gold, it has moved above its 200-day MA.
To state this differently, the picture for precious metals is bullish. The picture for stocks is bearish. Our previous posts will provide you an “intelligence briefing” on why this is so. Please review them carefully. And if you have any questions, simply call your RME broker. They are here to help you protect your wealth and to profit.
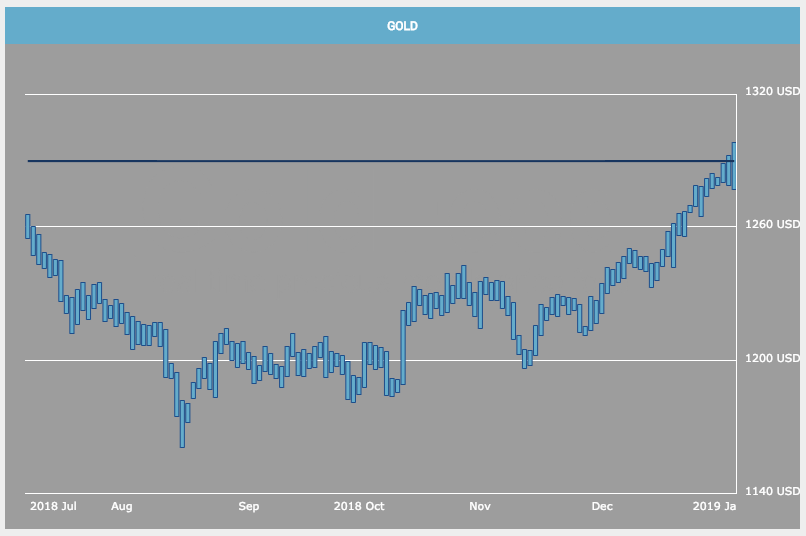
Have a look at Gold the previous 6 months:
…and Silver the previous 6 months: