Interest Rates: The Sign of the Times!
We would like you, and all our friends and clients, to take a good look at the accompanying chart. It will help you read the signs of the times.
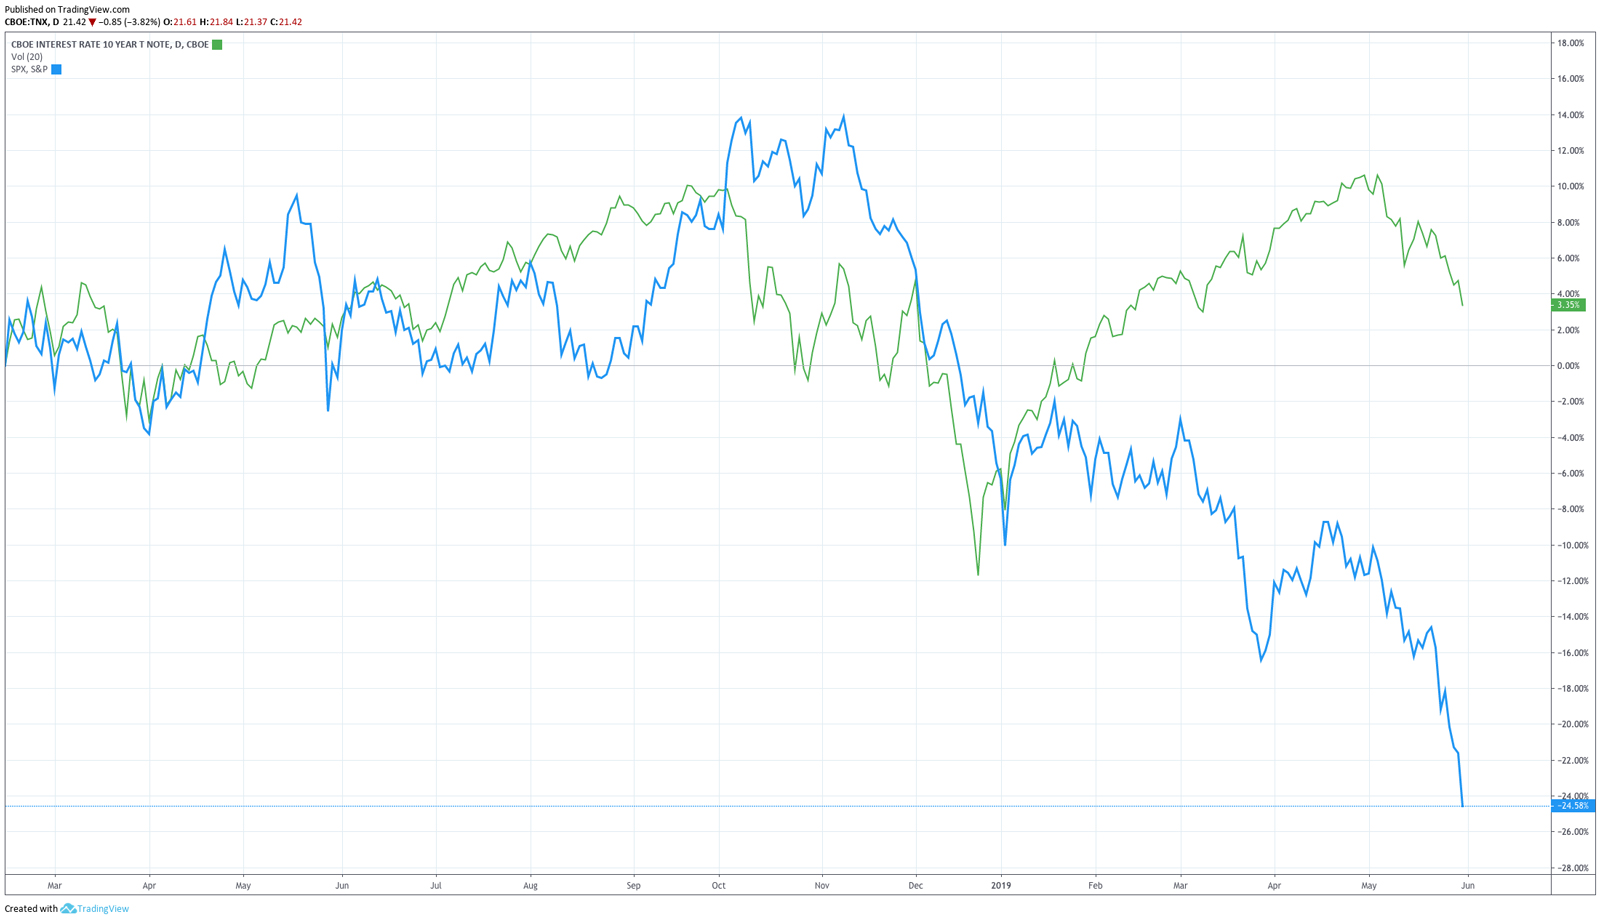
It is an eye-opening portrayal of this stage in the everything bubble! As you can see from the movement up by the S&P500 since last Christmas, the stock market has been powered by the Fed’s reversal of its announced interest rate increases at the end of last year.
In fact, as we have pointed out many times, this entire stock market bubble is the offspring of the Fed’s interest rate suppression.
The chart shows the yield on the 10-year US Treasury moving down, down, down, down.
Wednesday’s market action (5/29) was strong confirmation of the longer-term picture illustrated here. The 10-year yield fell to 2.26 percent. That’s the lowest yield since September 2017. At the same time stocks fell to 12- week lows, with the Dow Industrials gapping down to close beneath its 200-day moving average.
Lower yields mean that money is moving massively into the bond market. Why would Wall Street stampede into the bond market at these historic low yields? The answer comes in two parts:
They are getting out of the way of a stock market calamity.
And they expect that the Fed will respond to a stock market calamity by attempting to drive rates even lower – an effort to goose the economy as a recession looms.
We expect the same thing.
The Federal Reserve is a one trick pony. It has one thing that it does: It creates money and credit out of nothing. That is the Fed’s response to every crisis, a banking liquidity crisis, a housing bubble that popped, or a collapsing stock market.
One other important note:
There is an anomaly in the interest rate market called a yield curve inversion. In this case the yield on the 10-year Treasury is lower than the yield on the three-month Treasury.
That is abnormal. It is an important signal that something is amiss.
As we have pointed out, normally longer-term interest rates are higher than short-term rates. After all, whatever you might charge to loan someone money for three months, you would certainly want a higher rate to loan money for ten years. You have given up the use of your money for a longer time during which market rates may change markedly, while a longer-term increases the risks that can befall the borrower and the return of your money.
In normal markets, long-term rates are higher than short-term rates. An interest rate inversion like the one we are experiencing, when long-term debt instruments develop lower yields than short-term ones, is a classic indication of a weakening economy and of recessions.
It is an indication that investors are beginning to panic!
As a post on Zero Hedge put it, “The last two times the yield curve inverted like this were March 2000… right when the Tech Bubble burst… and late 2006… right as the housing bubble burst… and about 12 months before the Great Financial Crisis…”
This is a key juncture to buy gold. The deficit picture will worsen in a recession and Fed money printing will become much more aggressive. At the same time, many of the people fleeing the stock market, those who can read the signs of the times, will look to the safest of safe havens.
They will look to gold.
We hope you will take this warning seriously and do the same.