
Surprised by Gold’s Powerful Bull Market?
This chart will explain!
We would like our friends and clients to spend a few minutes thinking about what this chart means. We have chosen it because we think it explains today’s powerful gold bull market.
Even more, we think it makes clear that gold is headed higher.
But for as dramatic as this chart is, it doesn’t tell the whole story.
We’ll explain.
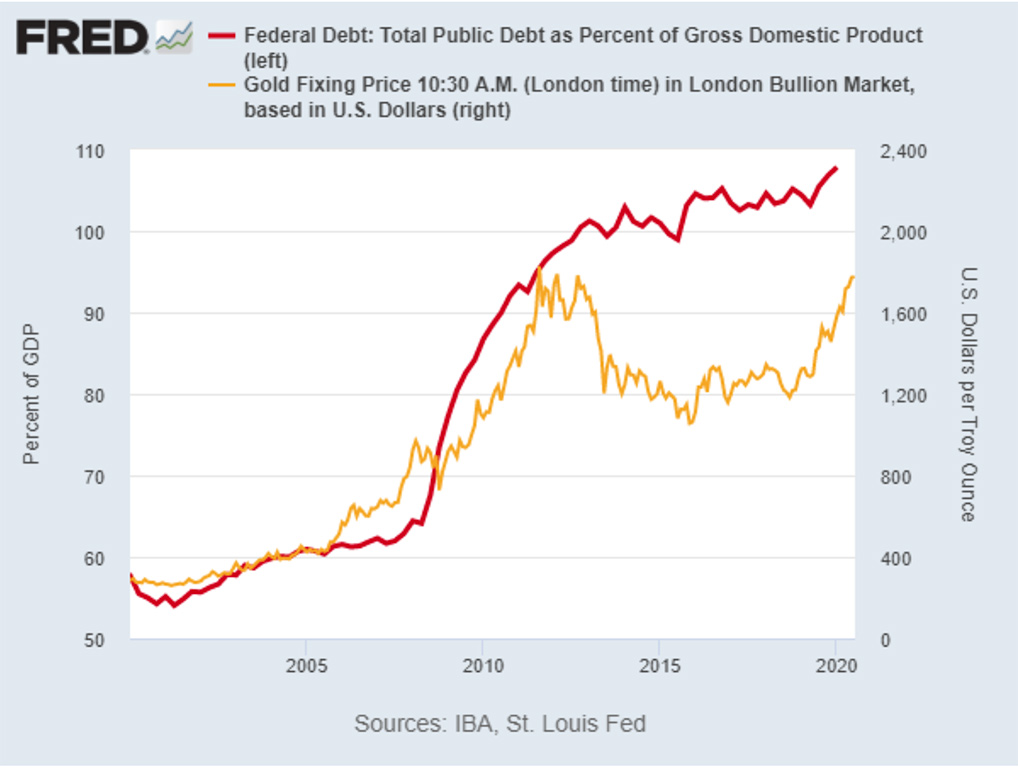
This chart overlays the gold price (in gold) with US federal debt as a percentage of US Gross National Product (in red) going back to the beginning of 2000.
It is from the Federal Reserve’s data and was produced from the Fed’s chart service on Wednesday (7/8/2020). At the beginning of this period federal debt was less than 60 percent of the nation’s total productivity.
The price of gold was less than $400 an ounce.
Now it shows that federal debt is more than the entire productivity of the nation, about 107 percent. And it is pulling the price of gold, now over $1,800, along with it.
Let us be clear why this should be so: The price of gold is a referendum on the future value of a currency. The dollar price of gold is a referendum on the future value of the dollar. As US debt continues to mount, this referendum on the market value of the dollar is not good.
There is more to the story, a couple of limitations with this chart. The Fed chart reflects the debt as of the first quarter of 2020. We are now in the third quarter and the debt is trillions of dollars higher.
It reflects the nation’s productivity as of the first quarter as well. But since then, productivity has collapsed.
Even though this reflects the latest numbers from the Fed, the conditions are today much more grim.
One other thing. Please note that the chart reflects total US government “public debt.”
The public debt is $20.56 trillion. But there is another part of the debt not shown, the so-called intragovernmental holdings. That is money the government has borrowed from the Social Security “Trust Fund,” Medicare, and other obligations of the government. That adds $5.9 trillion to the total government debt.
The total government debt is $26.46 trillion
That means that real ratio of debt to GDP—before the COVID-19 shutdown—is more like 137 percent of GDP.
Because US debt is so high, the US government is becoming a credit risk in the eyes of the world. The world knows that the government will resort to simply printing money to pay its creditors. Paying them with dollars of diminishing value. It knows this because that is what the US government is already doing.
The dollar price of gold is a referendum on the future value of the dollar. No wonder gold is in a primary bull market and headed higher.