Trading the Gold-Silver Ratio
What Is the Gold-Silver Ratio?
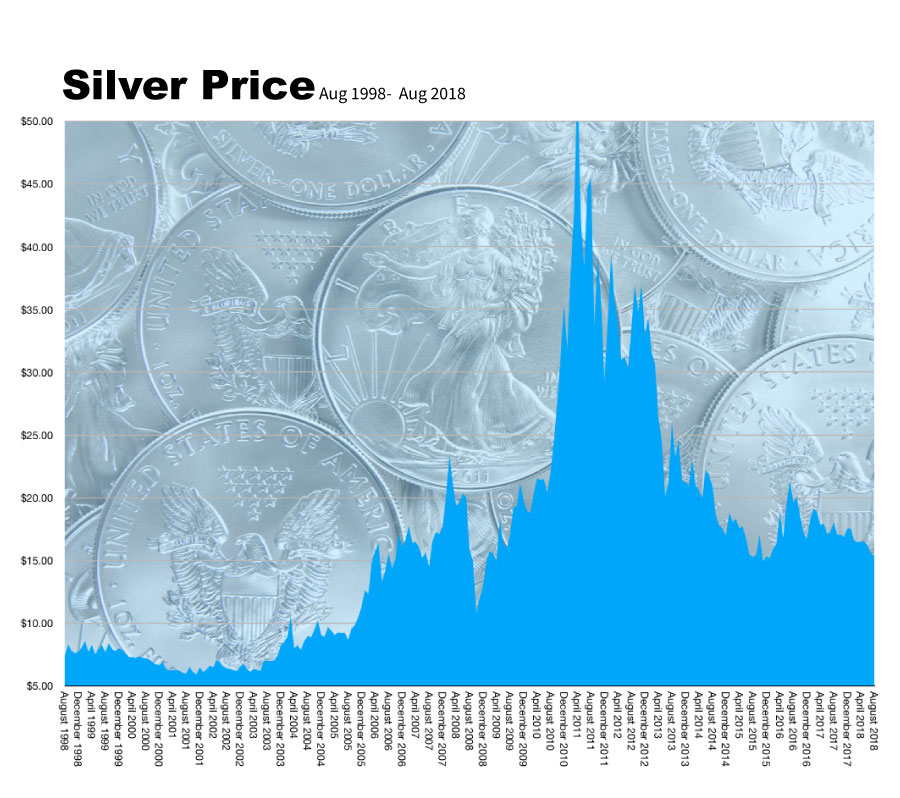
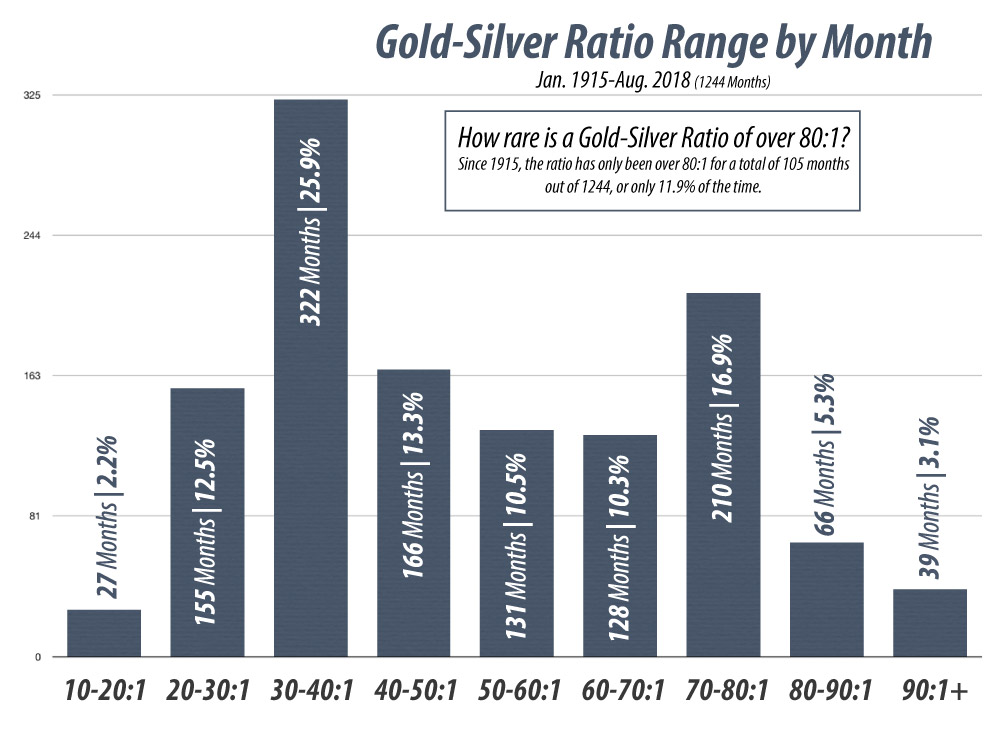
 You may have already heard the term Trading the gold-silver ratio, but let’s look into what the ratio represents and why it is often advantageous to exchange metals within a position. The gold-silver ratio is often a signal for an investor to exchange silver for gold or vice-versa to optimize the value of a precious metals portfolio. The gold-silver ratio measures the value of an ounce of gold relative to an ounce of silver. In other words, how many ounces of silver it takes to equal one ounce of gold. Right now, in August of 2018, the gold -silver ratio is unusually high. It’s currently sitting at about 80, and such a ratio indicates a lucrative buying opportunity for silver. This means that 80 ounces of silver are equivalent in price to 1 ounce of gold. Historically, a ratio like this precedes a bull run. As you will see in the chart below on this page, a ratio in the 80-90:1 range is quite rare, as the range historically represents only 5.3% of the the monthly closes since 1915. So through every economy in the past 103 years, including the crash of ’29, the ensuing Great Depression, BOTH World Wars, crash of 1987, and the banking disaster of 2008– throughout all of that history– we have only been in this range a little over 5% of the time. That simply makes this market of mid 2018, and the corresponding ratio, historic.
Silver, like gold, has been considered something of monetary value used to mark wealth throughout human history. Take a look at the fluctuations in the gold-silver ratio over the centuries. (Source)
– 2011 – The ratio collapsed to about 31. Silver had rallied, collapsing the ratio to 31.
– 2007 – For the year, the gold-silver ratio averaged 51. This means 51 ounces of silver were equivalent in price to an ounce of gold.
– 1991 – When silver hit its lows, the ratio peaked at 100.
– 1980 – At the time of the last great surge in gold and silver, the ratio stood at 17.
– End of 19th Century – The nearly universal, fixed ratio of 15 came to a close with the end of the bi-metallism era.
– Roman Empire – The ratio was set at 12.
– 323 B.C. – The ratio stood at 12.5 upon the death of Alexander the Great.
Understanding and Reading the Gold-Silver Ratio
So how exactly does the ratio work, and how does an investor read it? It’s no secret right now that metals prices – both gold and silver – have been facing headwinds against a strong dollar. Even in an economic environment of trade war, tariffs, record debt, an overvalued stock market, and uncertainty, metals haven’t been getting the demand one might expect to drive prices. Silver is looking particularly undervalued. But reading the gold-silver ratio can help predict how to maximize a portfolio’s value.
Looking back at the gold-silver ratio from 1991 to 2007, the current ratio is sitting closer to the market highs than to later lows. Yes, silver prices are low right now, and that’s why it is a great buy. The charts indicate that a bullish break for silver is coming. Historically, wide gold-silver ratios like the current one precede upward price movement, which is why savvy investors are buying now while silver is cheap before it makes makes that bullish break. The ratio now is similar to what it was just prior to the 2008 financial crisis and recession, when it also hovered around 80. Following the financial meltdown, silver rallied 400% over three years.
Why Silver Prices Will Go Up
It isn’t just investment buying that drives silver though. Silver has a multitude of expanding uses as an industrial metal (more so than gold). Some of these applications are solar panels, medical devices, and touch screen technology – all technology expected to grow. Rising demand in these sectors will eventually contribute to a rise in silver prices.